I trust we can all agree on one thing: economic policy is complex and nuanced - everybody seems to have an opinion about why the market seems to be falling like a rock.
A great example is the debate around the cause of the Great Depression. Several great points in this thread from Harry and Mike. I did read Mike's link to the entry at cato.org about the Smoot-Hawley Tariffs, it had interesting points. But consider monetary policy (Ben Bernanke focused on this as the cause). See this article which discusses Bernanke's views in his book "Essays on the Great Depression", also at cato.org:
https://www.cato.org/commentary/essays-great-depression-reviewed-anna-schwartz
The author of this article (Anna J. Schwartz, National Bureau of Economic Research), describes three different views from economists on the cause of the depression:
Since the 1930s, economists have pursued at least three different directions in research. At first, “overproduction” of some industrial output or a decline in a real sector of the economy (residential housing construction, business fixed investment, or real consumption expenditures) was emphasized as the source of the Depression. Since the 1960s, the emphasis has shifted to monetary shocks as the source of the downturn. Finally, beginning in the 1980s, a select group of proponents of real business cycles have favored technology shocks as the source of downturns in general.
Research in the first direction has been largely superseded by the shift to the monetary shocks approach of the second direction, which Bernanke embraces. He rejects the technology shocks approach of the third direction, discussed in an essay in the final part of the book that examines the evidence for a sample of U.S. manufacturing industries from 1923 to 1939.
In fact, since we're already here, searching
only on cato.org for "Causes of the Great Depression" returns
2,969 results.
Maybe there's another, more straight-forward cause for the current market turmoil: the market has been priced to perfection, all-time highs in the S&P 500 were reached two months ago, and traders were looking for a reason to sell.
Attached is a chart showing the S&P 500 PE Ratio, from December 1927 - March 2025 (source: https://www.macrotrends.net/2577/sp-500-pe-ratio-price-to-earnings-chart). For the last few months the PE Ratio has been hovering between 28-29, and has dropped to 24.1 as of April 1.
For comparison, other recent highs were:
- 122.4 - March 2009 "Great Recession"
- 46.5 - March 2001 "Dot-com mania blowoff"
- 38.2 - December 2020 "Covid vaccines available"
Sometimes, we may just be looking in the wrong place for the answer.
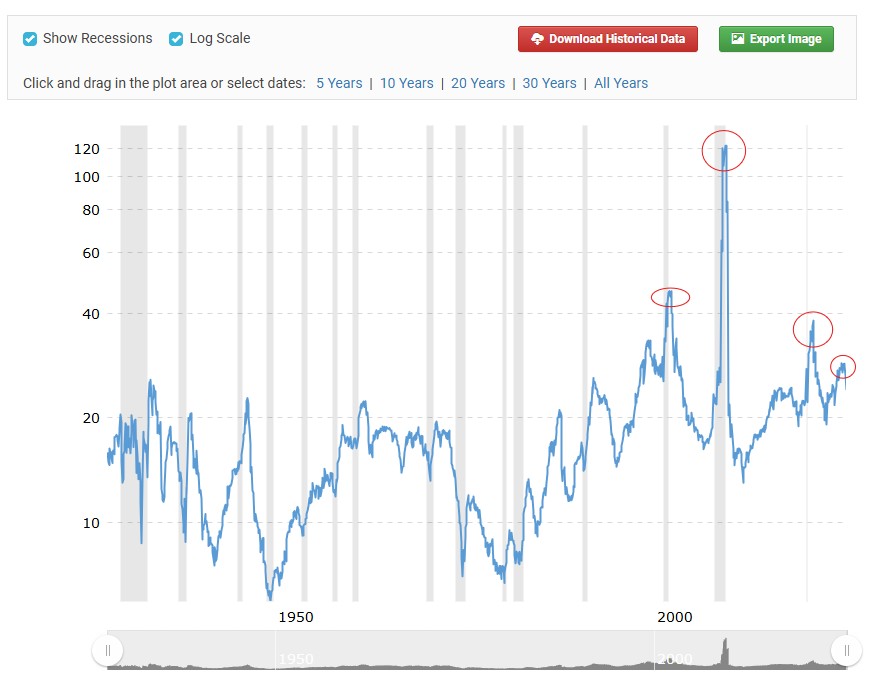
- S&P 500 PE Ratio
- SP 500 PE Ratio.jpg (80.8 KiB) Viewed 2505 times
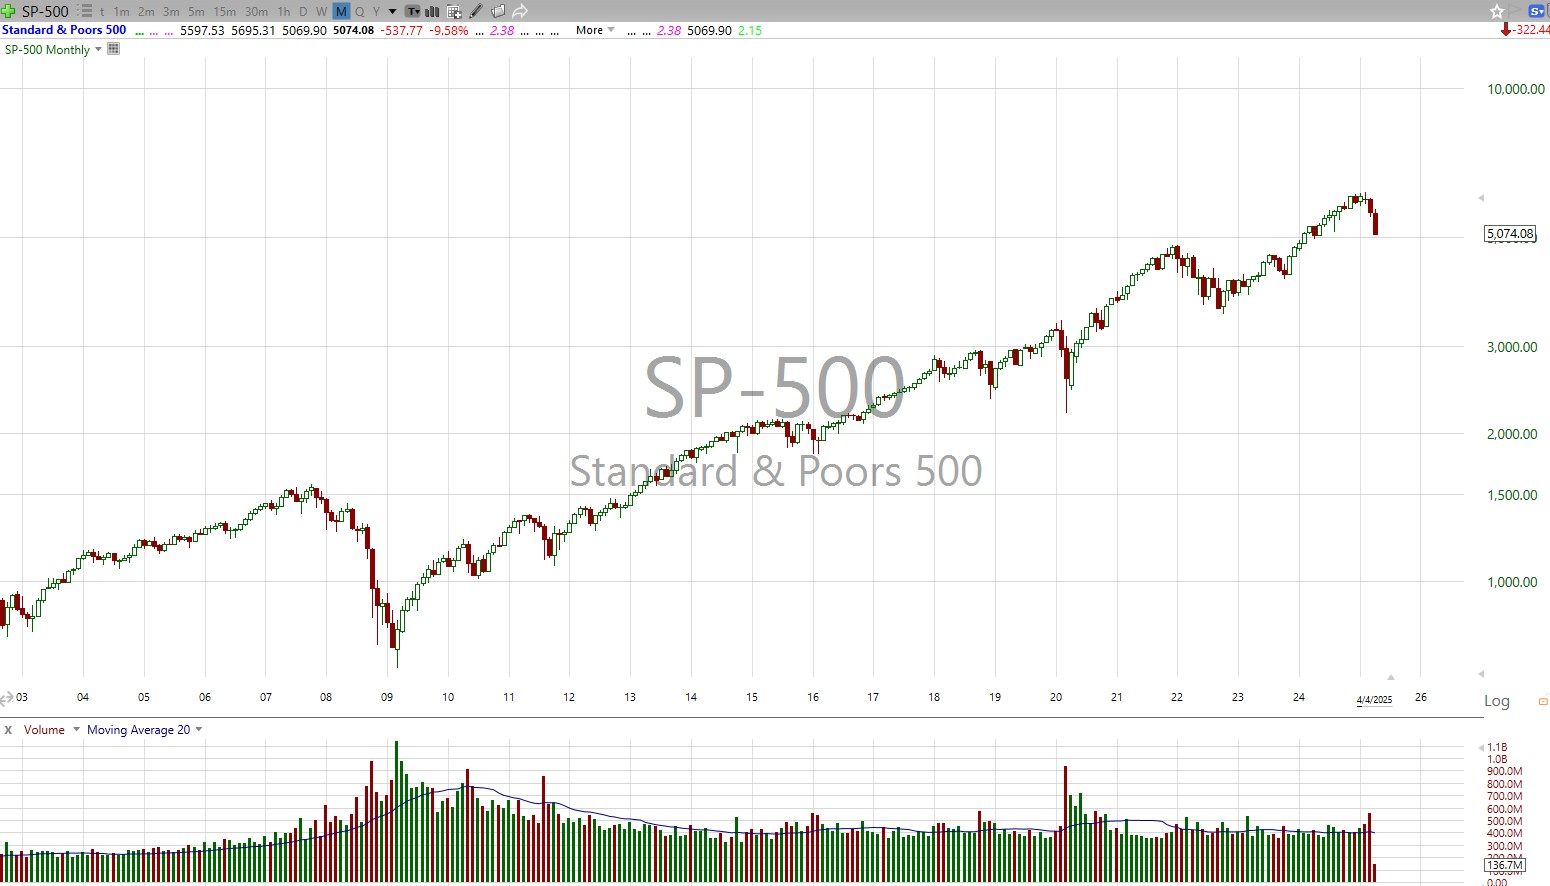
- S&P 500 Monthly
- SP 500 Monthly.jpg (210.53 KiB) Viewed 2362 times